✓ The different types of reporting metrics to focus on
✓ Different reports to consider
✓ The different types of reporting metrics to focus on
✓ Different reports to consider

When analyzing your google search campaigns, it can be overwhelming as there are so many different metrics to look at. From impressions, to clicks, to CTR, there are multiple metrics to assess. However, they are all equally important in telling you the whole picture. For example, if you are getting a bunch of impressions but very few clicks, your CTR will be low. WIth that said, all the metrics should be considered together.
In this chapter of Learn Search With Amelia, I will take you through the most important metrics to analyze and what different reporting tools you can look at to get the most meaningful information.
In simple terms it is how much money you are getting back from your ad spend – one of the most fundamental metrics in advertising.
The formula for this metric is: ROAS = $ spent on ads / $ received from ads.
For this metric to be meaningful you need to keep track of deals and sales. In order to calculate this metric you should track where customers/leads came from.
This is the amount spent per desired action taken i.e a sign up.
It can be one of the most important metrics for an individual campaign especially for cost per click campaigns.
This is the rate at which users are taking a desired action post click.
This metric often tells you if your landing pages are optimized, if you’re using the right keywords and if you’re targeting the right people.
Adding Negative Keywords is a good way to optimize this. If people are searching for terms that are irrelevant to your business, you want to make sure to add those as Negative Keywords in your campaigns.
Clickthrough rate tells you how many people have seen your ad and consequently clicked through on it. It is an important metric to consider, however, if you aren’t getting quality clicks then it can become unimportant. What the users do after clicking on your ad is what counts.
However, if an ads CTR is too low, it can affect quality score.
Cost per click is how much you pay per click. Although there isn’t a lot of control over how much you pay per click, if you have the right bidding strategy in place and a well-optimized campaign, your CPC should lower over time.
One of the most important metrics and indicators of well performing campaigns in analytics is your quality score. It runs on a 1-10 scale and is calculated based on ad relevance, CTR and your landing page experience. If all of these components are matched up and relevant to one another, your quality score will be high.
You should always be checking your quality score and revising your keywords, ads and landing pages respectively to ensure a high quality score.
Impression share is a measure of how often your ads are showing compared to how much they could have been shown. This metric is based on your budget and ad rank. Google will show ads that are more relevant and are bidding higher against competitors ads.
Impression share is a super important metric to understand why your ads aren’t showing. If it’s a ranking issue, you may want to adjust your ads to be more relevant. However, if it’s a budget issue, this can be easily adjusted depending on how much you’re willing to spend.
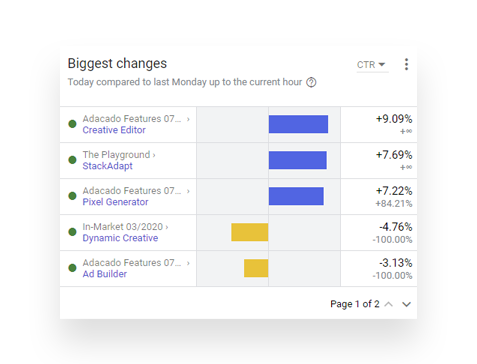
The biggest changes report can be found in the overview section of your dashboard. This report gives you insight into the biggest changes compared to the same day of the previous week. You can compare metrics such as cost, impressions, clicks etc.
Consider looking at conversions. If one campaign is doing super well in comparison to last week, try pausing a campaign that isn’t doing so well or reduce the budget in favor of that campaign.
The biggest changes report shows you the big picture of what’s happening – good or bad to your campaigns and it gives you a comparison of how you are doing now compared to last week at the same time.
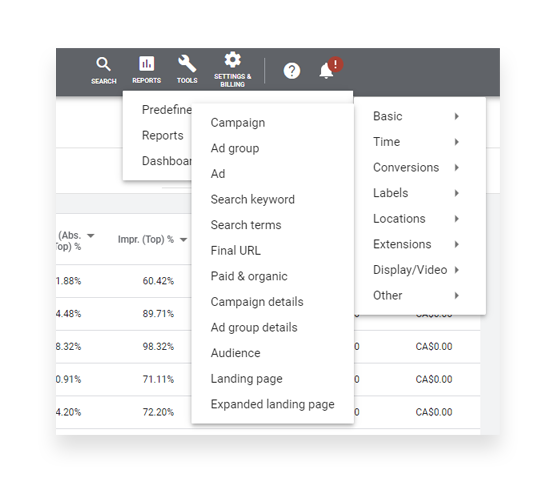
The keyword report can be accessed on the top right hand corner of the dashboard. You can access the keyword report by clicking on “reports” → “pre defined reports” → “basic” → “search keyword”.
This report gives you insights into how your keywords are performing. You can track the amount of clicks, impressions, how expensive each keyword is and so on.
It’s a useful tool to see which keywords are performing well.
To access this report, click on campaigns, ad groups or keywords and then click on “auction insights”. From here you will be able to see where you stand in comparison to your competitors.
It is extremely useful in looking at these insights at the campaign level so you can see which campaign is doing best in terms of being ahead of the competition.
If you are being outranked by your competitors, you could try adjusting your bids or ads in order to increase your quality score.
These “outranking shares” tell you whose ads are being placed higher than the others and it is likely that your quality score isn’t high enough if your rank is low.
Overall, the auction insights report shows you how well you are doing in comparison to your competitors and is important to monitor.