Analyzing your campaign performance in Adacado
Analyzing the performance of your campaign is one of the most important aspects of advertising. Without data your campaign is meaningless.
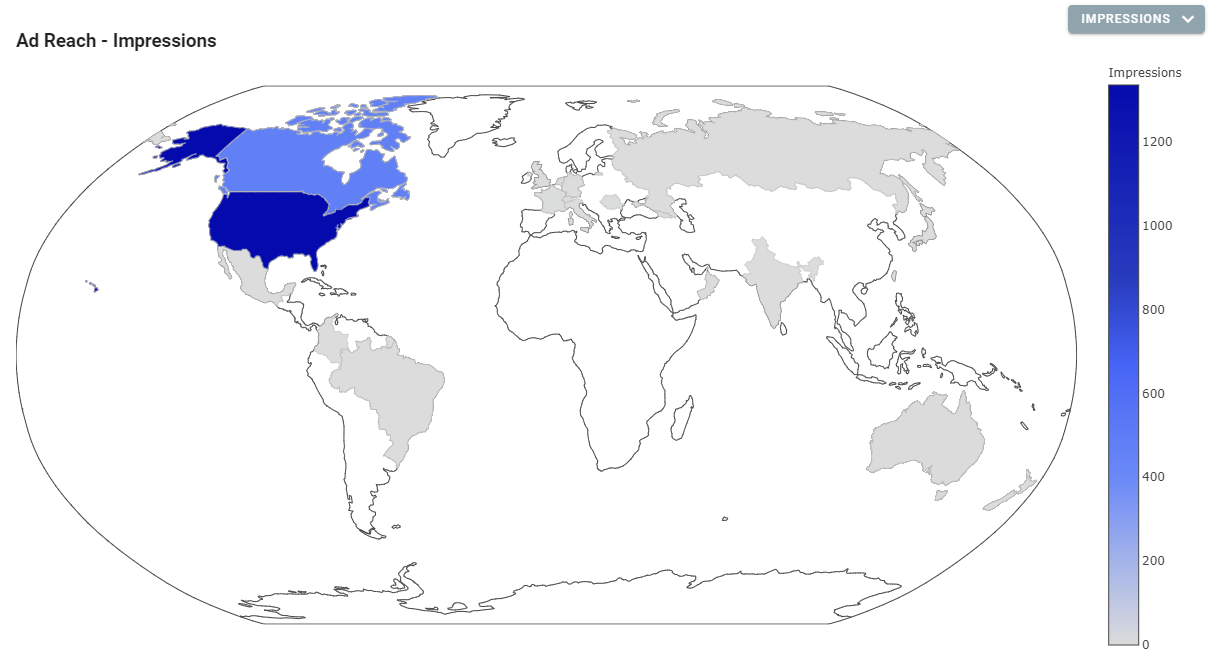
Analytics reports give you an overview of key metrics such as impressions, clicks, CTR and CPM. You can also see data corresponding to impressions by location, device and browser.
As well, some platforms such as Adacado provide you with Click Heat Maps that show you where users are clicking on your ad. This information tells you where most people are clicking, so that you know where to place your CTA button.
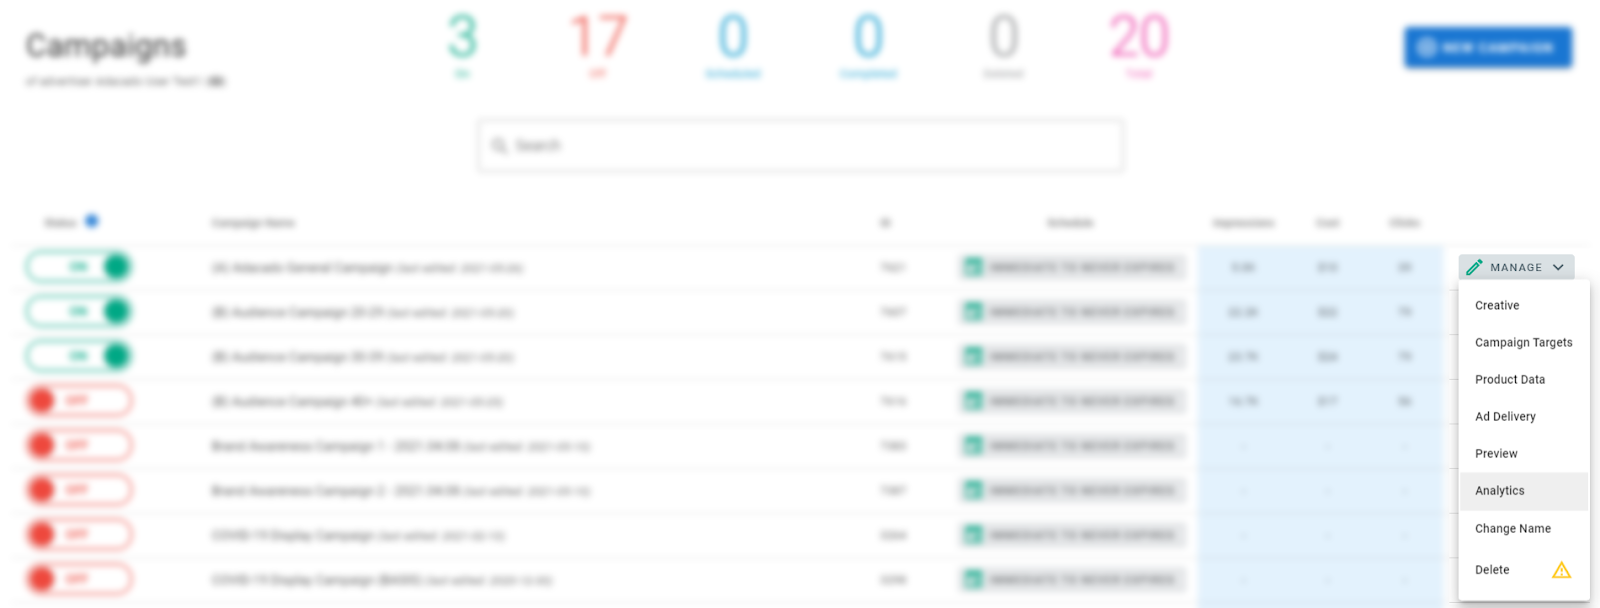
Accessing my analytics reports in Adacado
You can access your reports 3 different ways in Adacado.
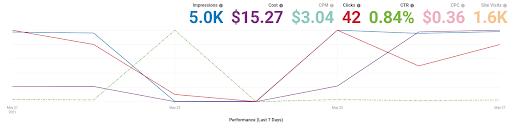
The first way is through the campaign list page. Beside each campaign you will see a button called “manage”. Under there you can click “analytics” which will take you to the analytics dashboard. As well in this view you can see impressions, cost and click data (last 7 days) for each campaign.
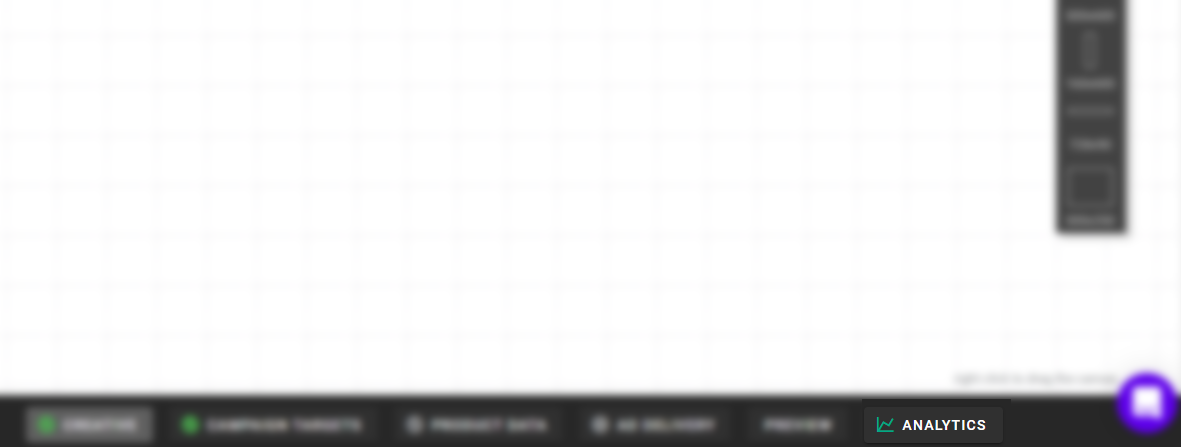
The second way is accessing the analytics dashboard when viewing a specific campaign. Once you have selected a campaign, you will see 6 tabs at the bottom, one of which is the analytics tab. Click that, and you will be taken to the analytics dashboard.
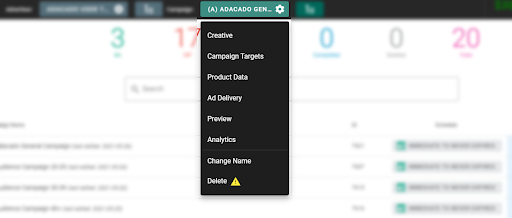
Lastly, you may also access your analytics in the header. Whether you are looking at a current campaign, or viewing your invoice, you can easily access your campaign data. Click the green settings wheel at the top of the page to take you to the analytics dashboard. The default campaign will be your last viewed campaign.
The analytics dashboard
When you get to the analytics dashboard, you will see that there are two tabs. This includes “Campaign Overview” and “Insights”. They both have their own purpose.
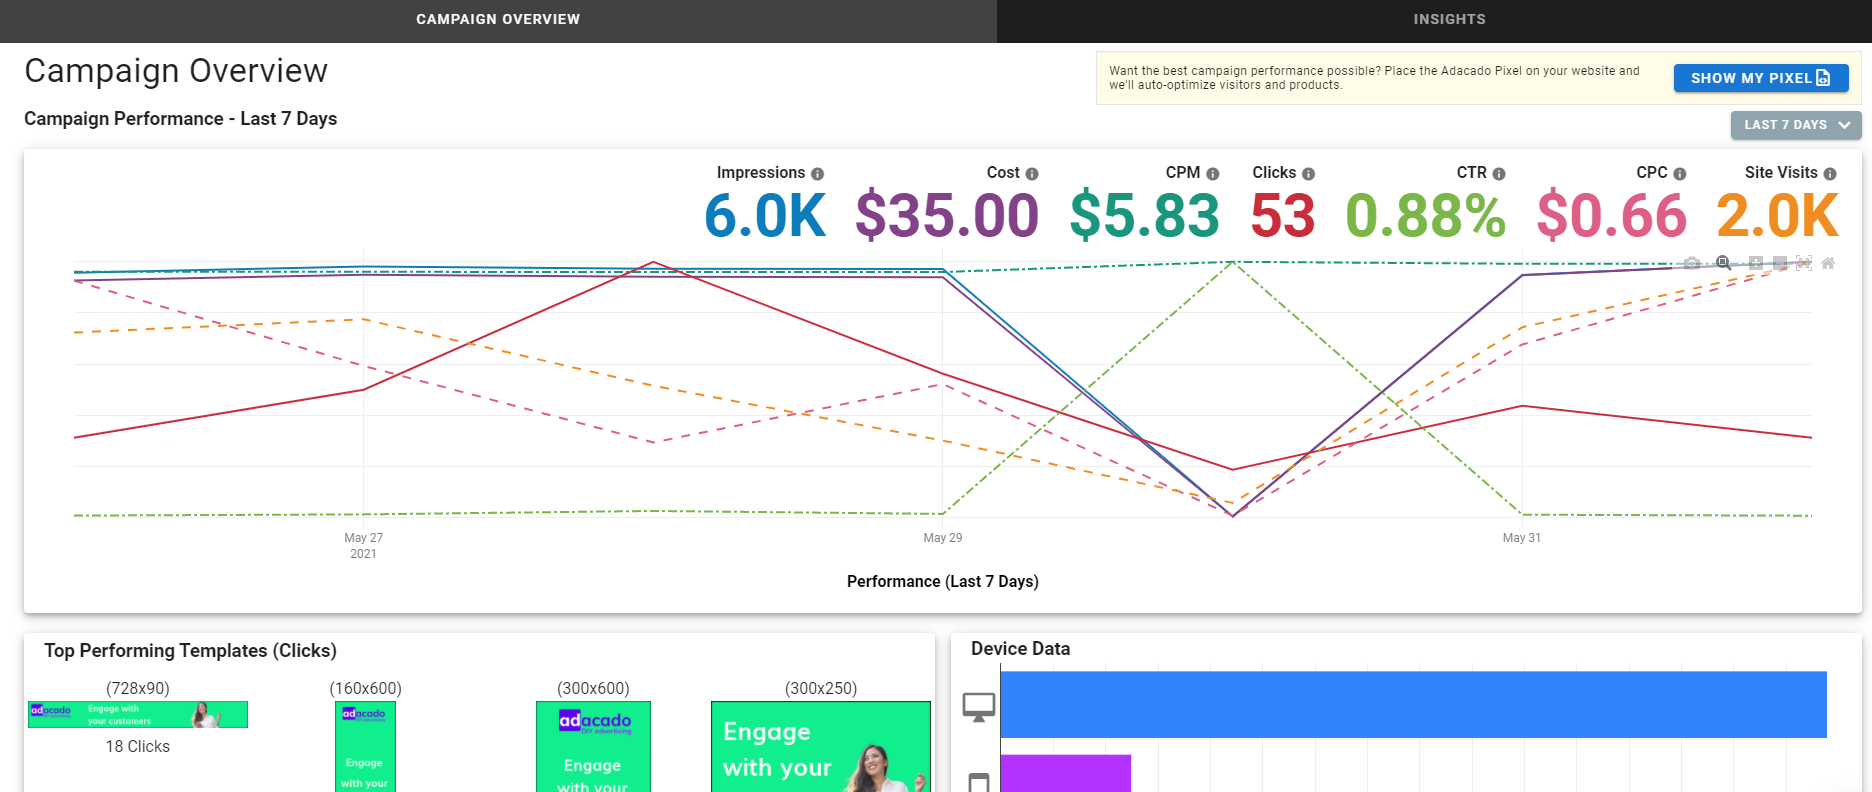
Campaign overview
The Campaign overview page provides you with the overall picture of your campaign. You can view metrics like impressions, clicks, CTR, CPM and more. These metrics can be viewed at different time intervals such as yesterday or even the last 30 days.
These numbers are also displayed on a graph. To view individual metrics on the graph, simply click the metrics you want displayed.
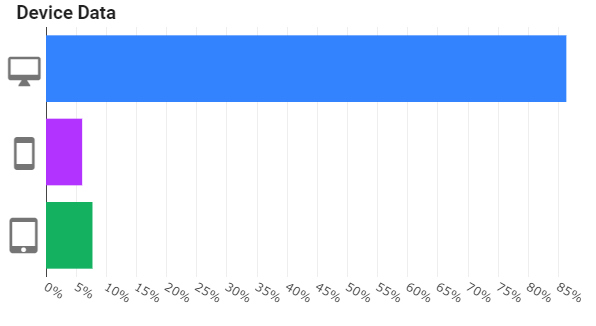
At the bottom of the page, you will also see device data and your top performing template sizes (related to number of clicks).
Insights
The insights page is a bit more granular in the sense that it shows you specific impression data.
This page gives you insight into impression data such as location, device type and browser. As well, you can view where users are clicking on your ads with a feature called “Ad Click Heat Map”. You can view this data at different time intervals such as yesterday, last 7 days, last 30 days and last 90 days.
Tips for analyzing your campaign performance
Tip #1 – Check your campaign overview metrics
At the top of the campaign overview dashboard, you will see 7 different metrics that are being tracked. This includes impressions, cost, CPM, clicks, CTR (click through rate), CPC and site visits.
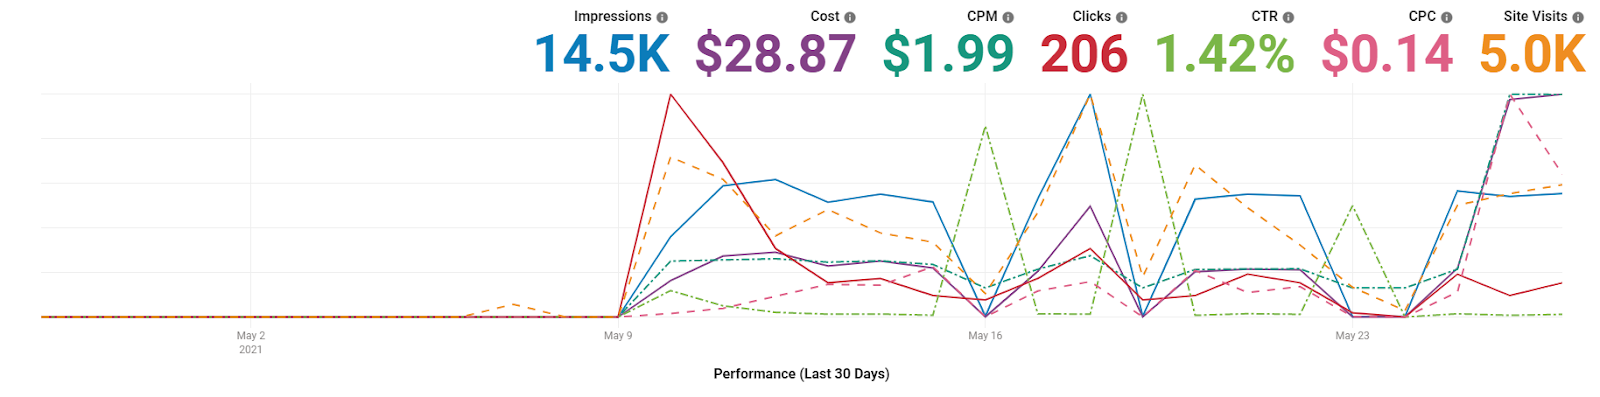
Compare these numbers at different time intervals such as last 7 days or last 30 days (depending on how long your campaign has been running). More specifically, you want to pay attention to metrics like impressions, clicks, CTR and cost.
Impressions will tell you how many people have seen your ad, whereas clicks will tell you how many people clicked on your ad. CTR will tell you the percentage of people who saw your ad then clicked.
You want to keep an eye on your CTR for an upward trend over time. This metric will help you understand how your campaign is performing. The average CTR for display advertising is between 0.39-1.08%, with Adacado offering CTR’s above industry standards.
You have the ability to decide which metrics you would like visible on the graph. You can do this by individually selecting each metric.
Tip #2 – Analyze your top performing template sizes
At the bottom of the campaign overview dashboard, you will see a section for ‘Top performing templates’.
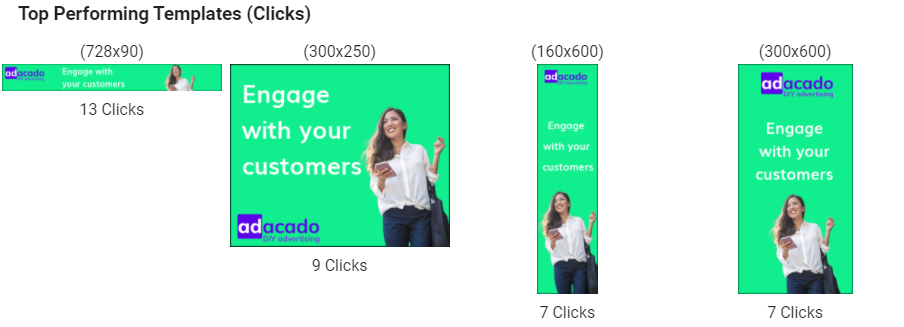
This section will show you which template sizes are performing the best based on the number of clicks. Further, if you want to narrow down the number of templates used in your campaign, you can remove the least performing templates.
Tip #3 – Analyze the insights tab in the analytics dashboard
You will notice 4 different sections within this tab of the analytics dashboard.
First, take a look at your impressions served by location. Here you will see where your ads are being shown by hovering over different areas within the world map. Depending on your campaign goals, you can test different locations to see which areas perform better. To do this, navigate to the ‘ad delivery’ tab and select your new locations.
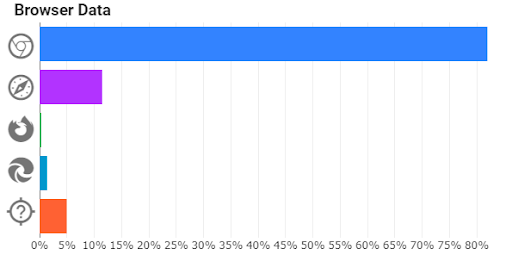
Next, look at your device and browser data. Here you will get a breakdown of the types of devices your ads are showing on, as well as the browser type. You can adjust these settings at any time.
Finally, you will see the ‘ad click heat map’ at the bottom. This feature illustrates where people are clicking on your ad. This feature is helpful as it shows you where people are likely to click. From there, you can adjust your CTA button which will ultimately increase your CTR.
Tip #4 – Keep tracking!
The last and most important tip is to keep tracking your campaign’s progress.
Your campaign is only as good as you make it. So, continuously optimizing your campaigns will increase your campaign’s performance over time.
To sum it up
Tracking campaign performance is a habit every advertiser should get into so that you can see what is working and what is not.
The tips suggested above are a great starting point for good analysis and optimization of your online advertising campaigns.